6.1 EMP_alpha_analysis
Welcome to this tutorial, which aims to provide users with a comprehensive guide to data analysis. Through this tutorial, users will learn how to use a variety of data analysis methods to process multi-omics data, including but not limited to difference analysis, association analysis, enrichment analysis, feature screening, and other mainstream bioinformatics analysis methods. Each functional module can be easily and seamlessly connected to standardize and clarify the entire analysis process, ensuring the scientificity and repeatability of the analysis results.
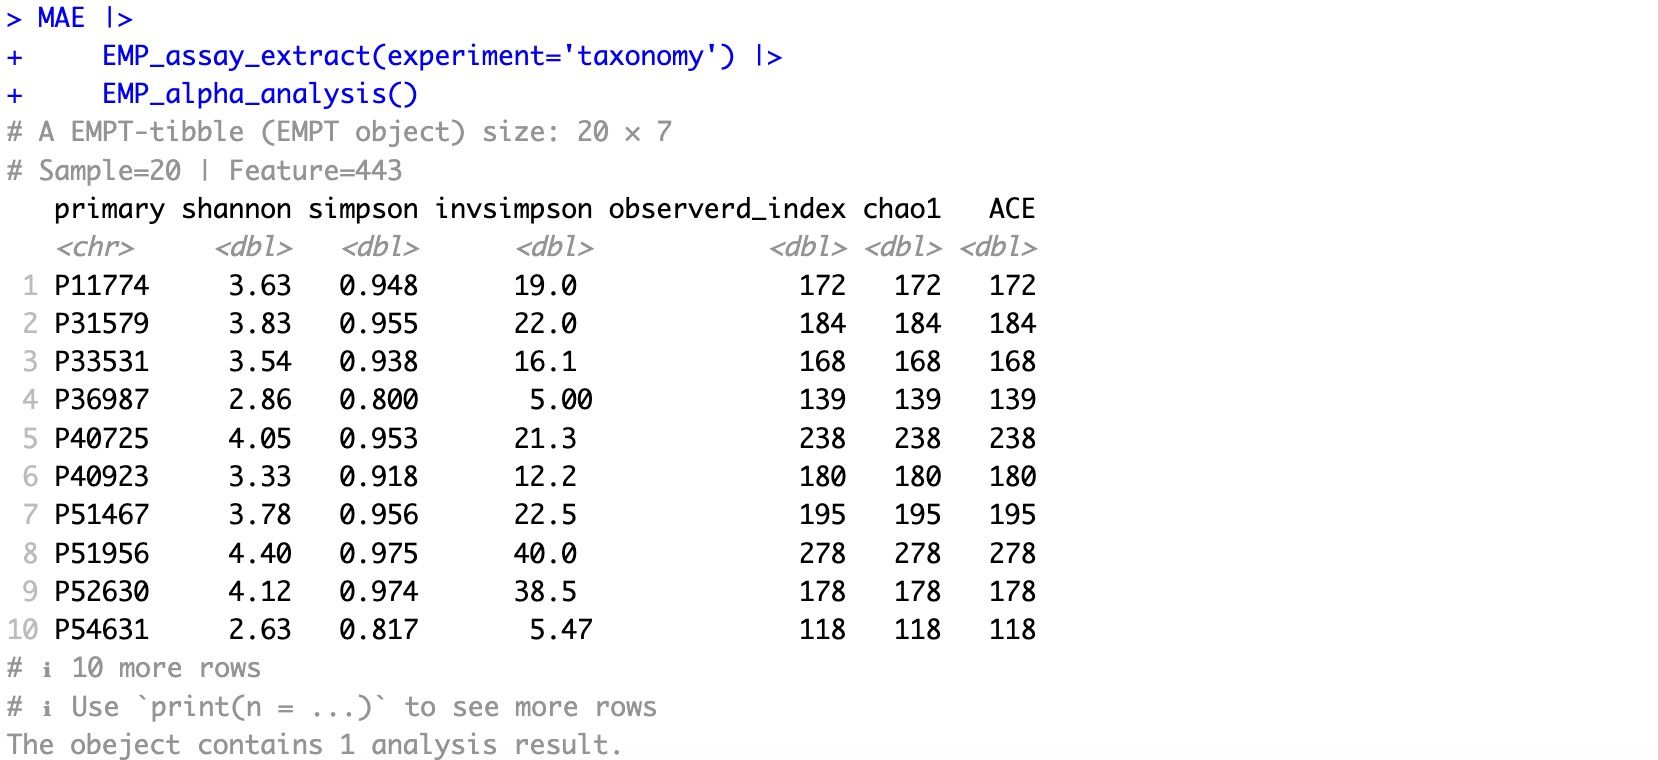
6.1.1 Use absolute abundance for diversity analysis
🏷️Example:
MAE |>
  EMP_assay_extract(experiment='taxonomy') |>
  EMP_alpha_analysis()
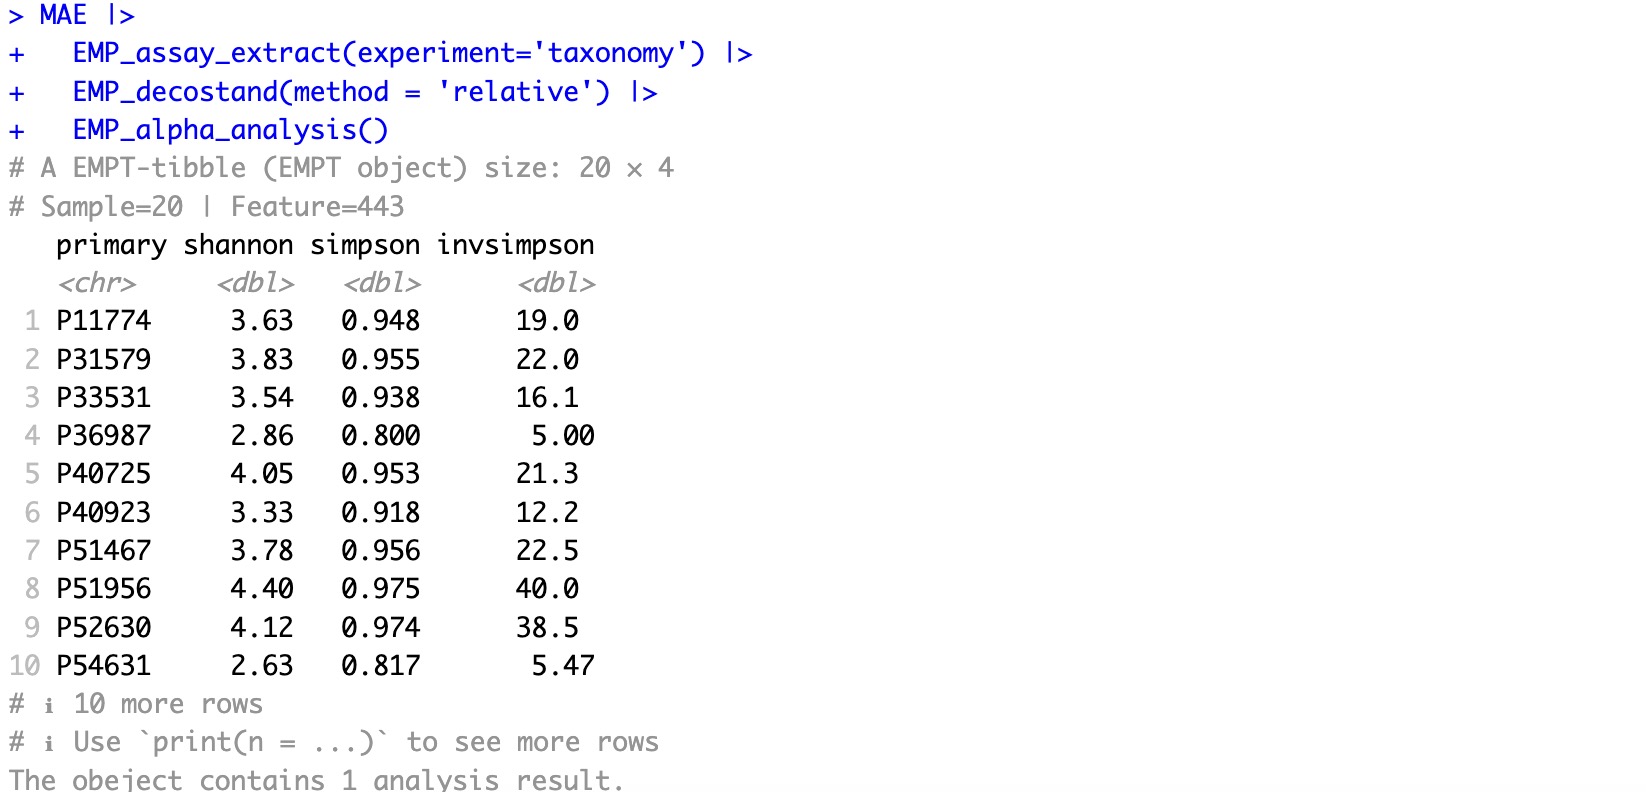
6.1.2 Use relative abundance for diversity analysis
Note:
When relative abundance is used, some alpha indices (e.g. ACE, chao1) will not be calculated.
When relative abundance is used, some alpha indices (e.g. ACE, chao1) will not be calculated.
🏷️Example:
MAE |>
  EMP_assay_extract(experiment='taxonomy') |>
  EMP_decostand(method = 'relative') |>
  EMP_alpha_analysis()
6.1.3 Visualization of difference analysis result
Note:
The module
The module
EMP_boxplot can filter the required alpha diversity indicators by specifying the parameter select_metrics.
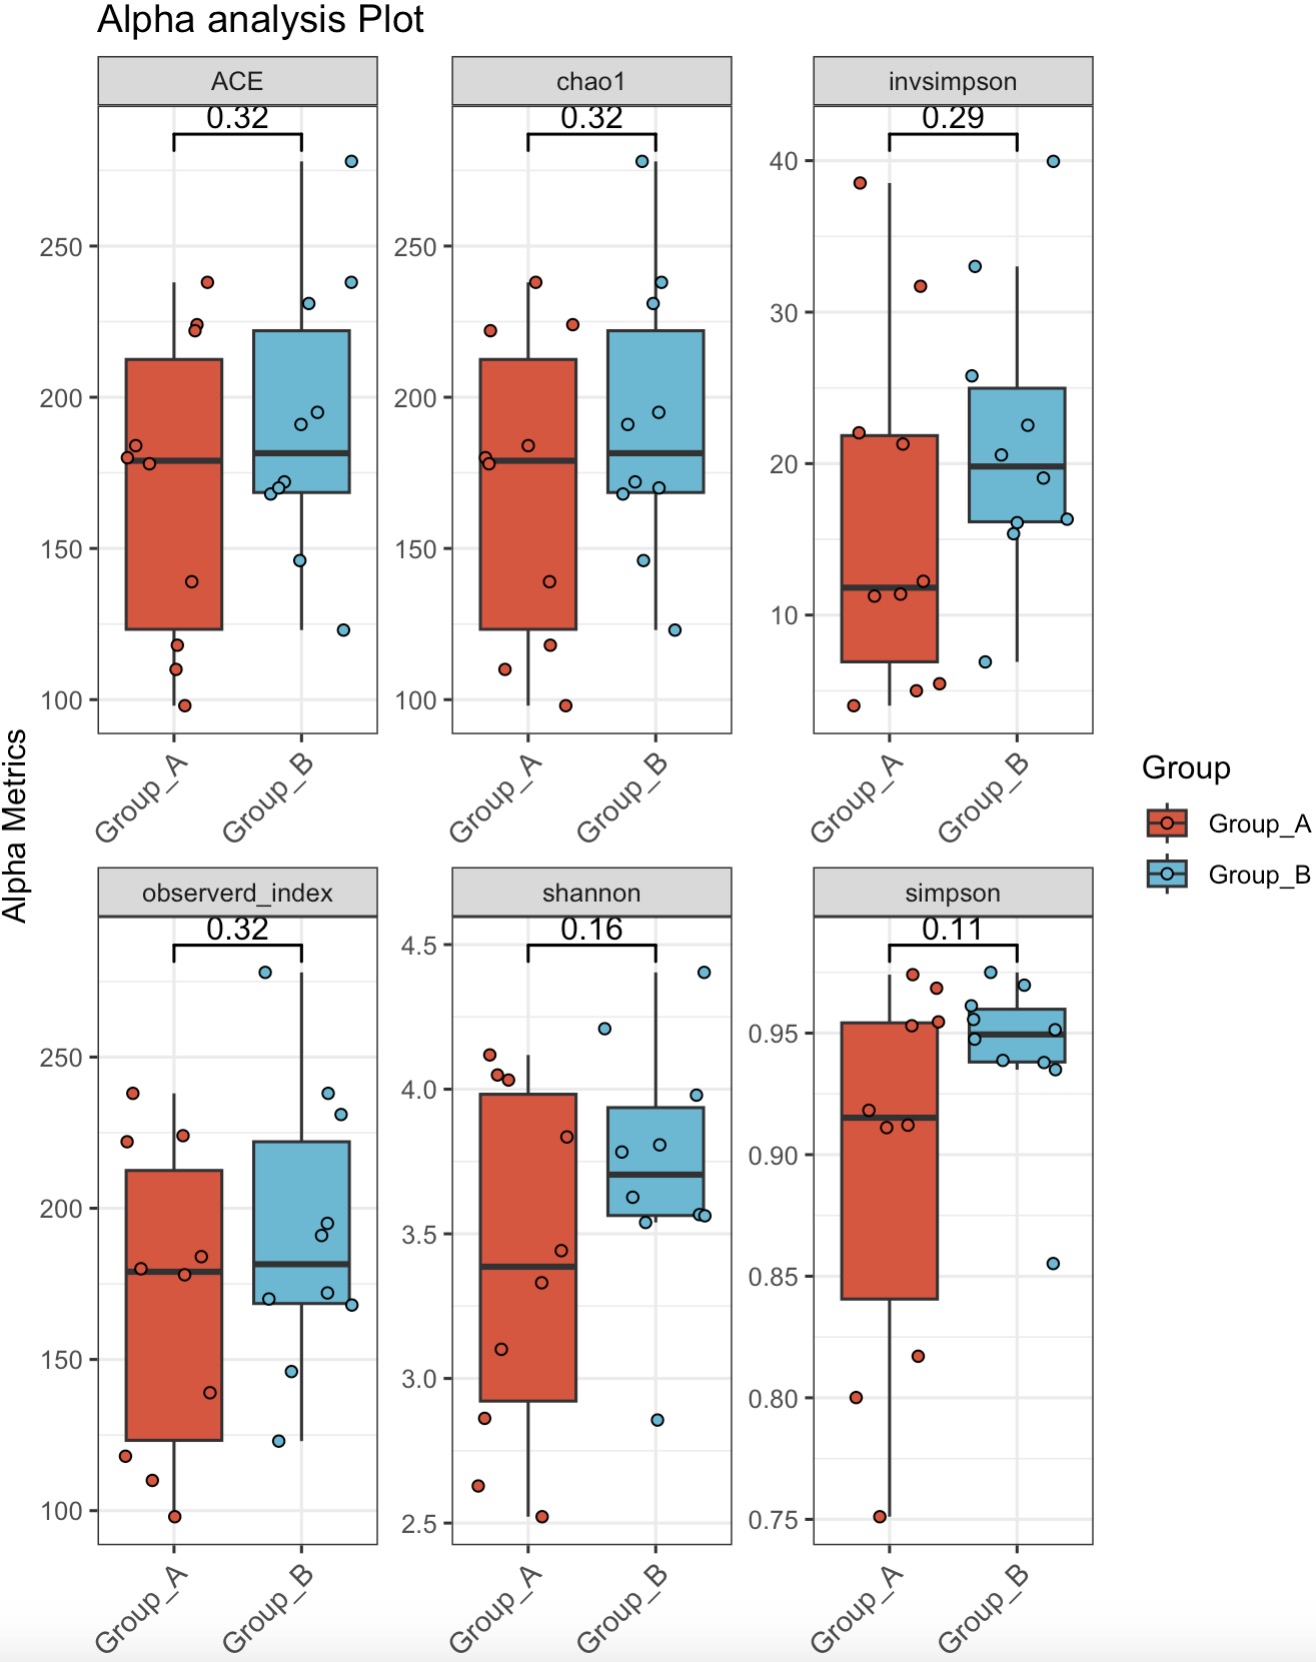
🏷️Example1:
MAE |>
  EMP_assay_extract(experiment='taxonomy') |>
  EMP_alpha_analysis() |>
  EMP_boxplot(estimate_group='Group',method='t.test')
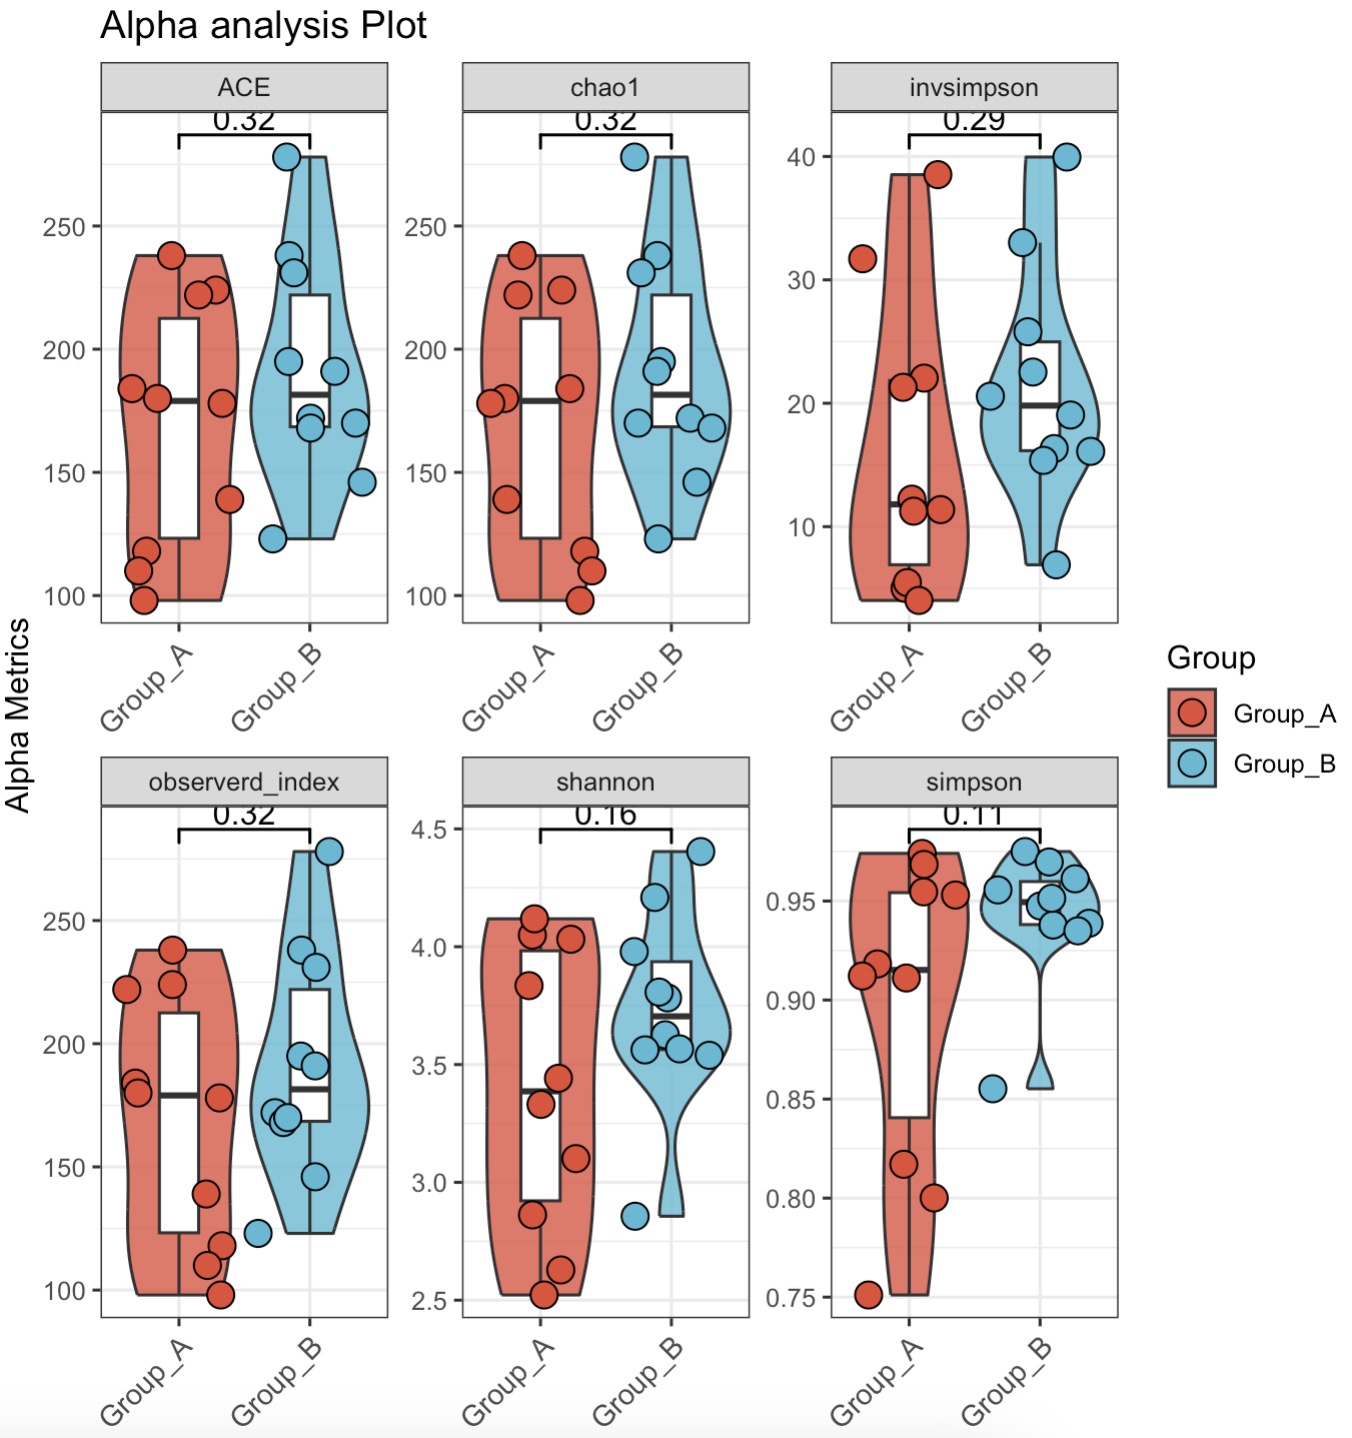
🏷️Example2:
MAE |>
  EMP_assay_extract(experiment='taxonomy') |>
  EMP_alpha_analysis() |>
  EMP_boxplot(estimate_group='Group',method='t.test',
              plot_category='violin',dot_size=4)